Dispensing Statistics
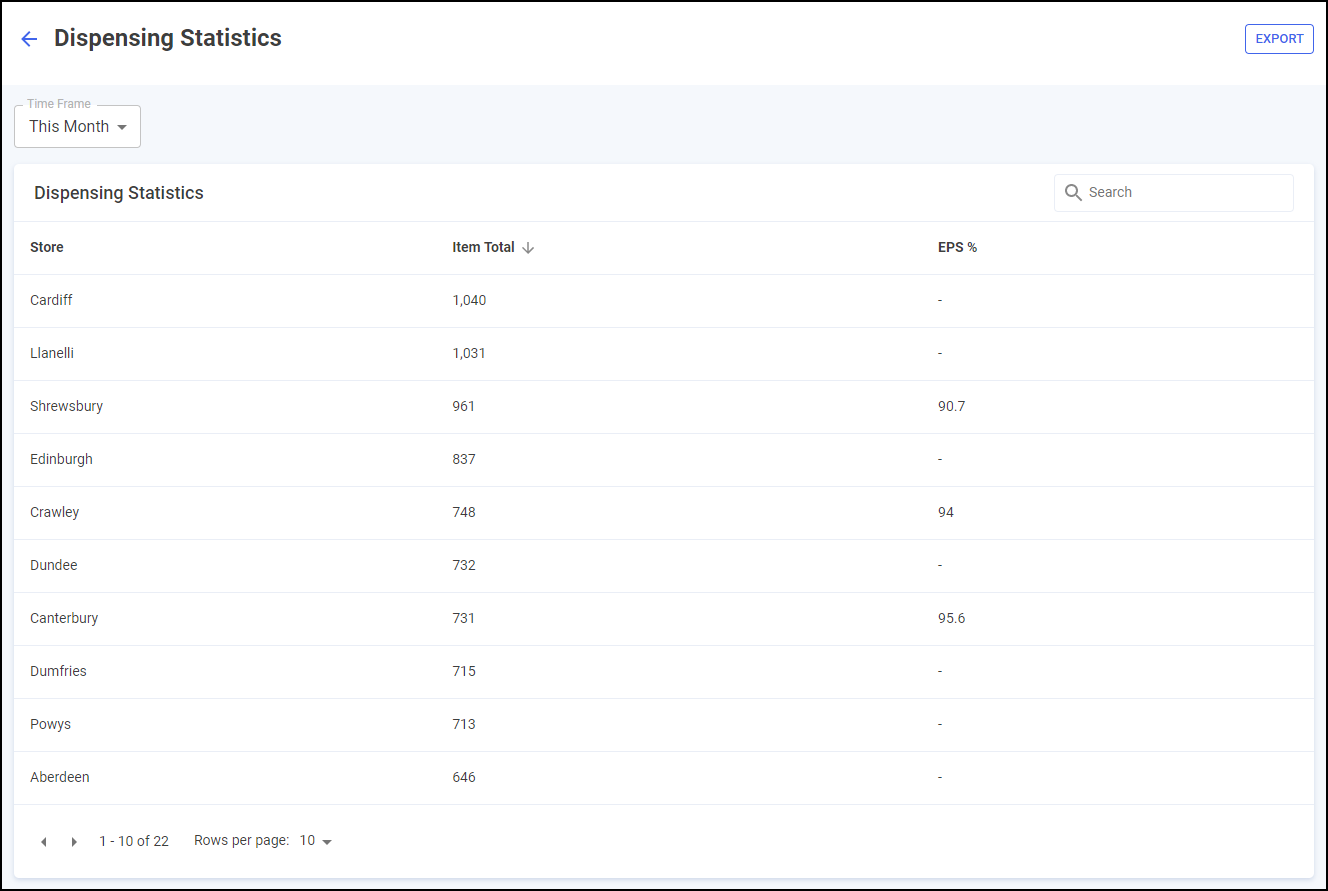
The Dispensing Statistics screen displays the volume of prescription items labelled across your pharmacy group:

Time Frame
You can easily filter the data that displays on the Dispensing Statistics screen, simply select Time Frame and choose the time range required:

Dispensing Statistics Table
The Dispensing Statistics league table displays additional information relating to the dispensing statistics of pharmacies across your group, in ranked order:

-
Search - To search for an individual store, simply enter the store name in Search
 and the table updates as you type.
 -
Sorting Data - Select any header to sort pharmacies by the chosen header, for example, select Item Total to sort pharmacies by the highest/lowest number of items labelled.
Exporting Data
To export Dispensing Statistics data within your group to a CSV file:
-
From the Dispensing Statistics screen, select EXPORT
 :
:
-
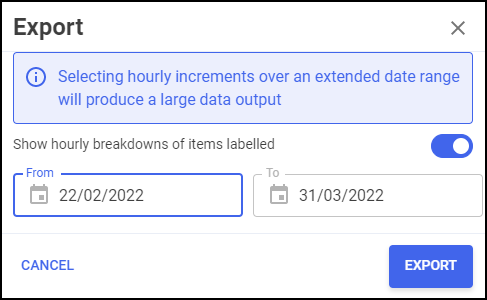
The Export screen displays:

Select Show hourly breakdowns of items labelled if required.
Important - Selecting hourly increments over an extended date range produces a large data output and therefore takes longer to export. -
Select the date range to export.
-
Select EXPORT
 to export the CSV file to your local Downloads folder. Training Tip - To view the Downloads folder, open Windows File Explorer, locate and open Downloads. A list of your recently downloaded files display.