Top Product Usage
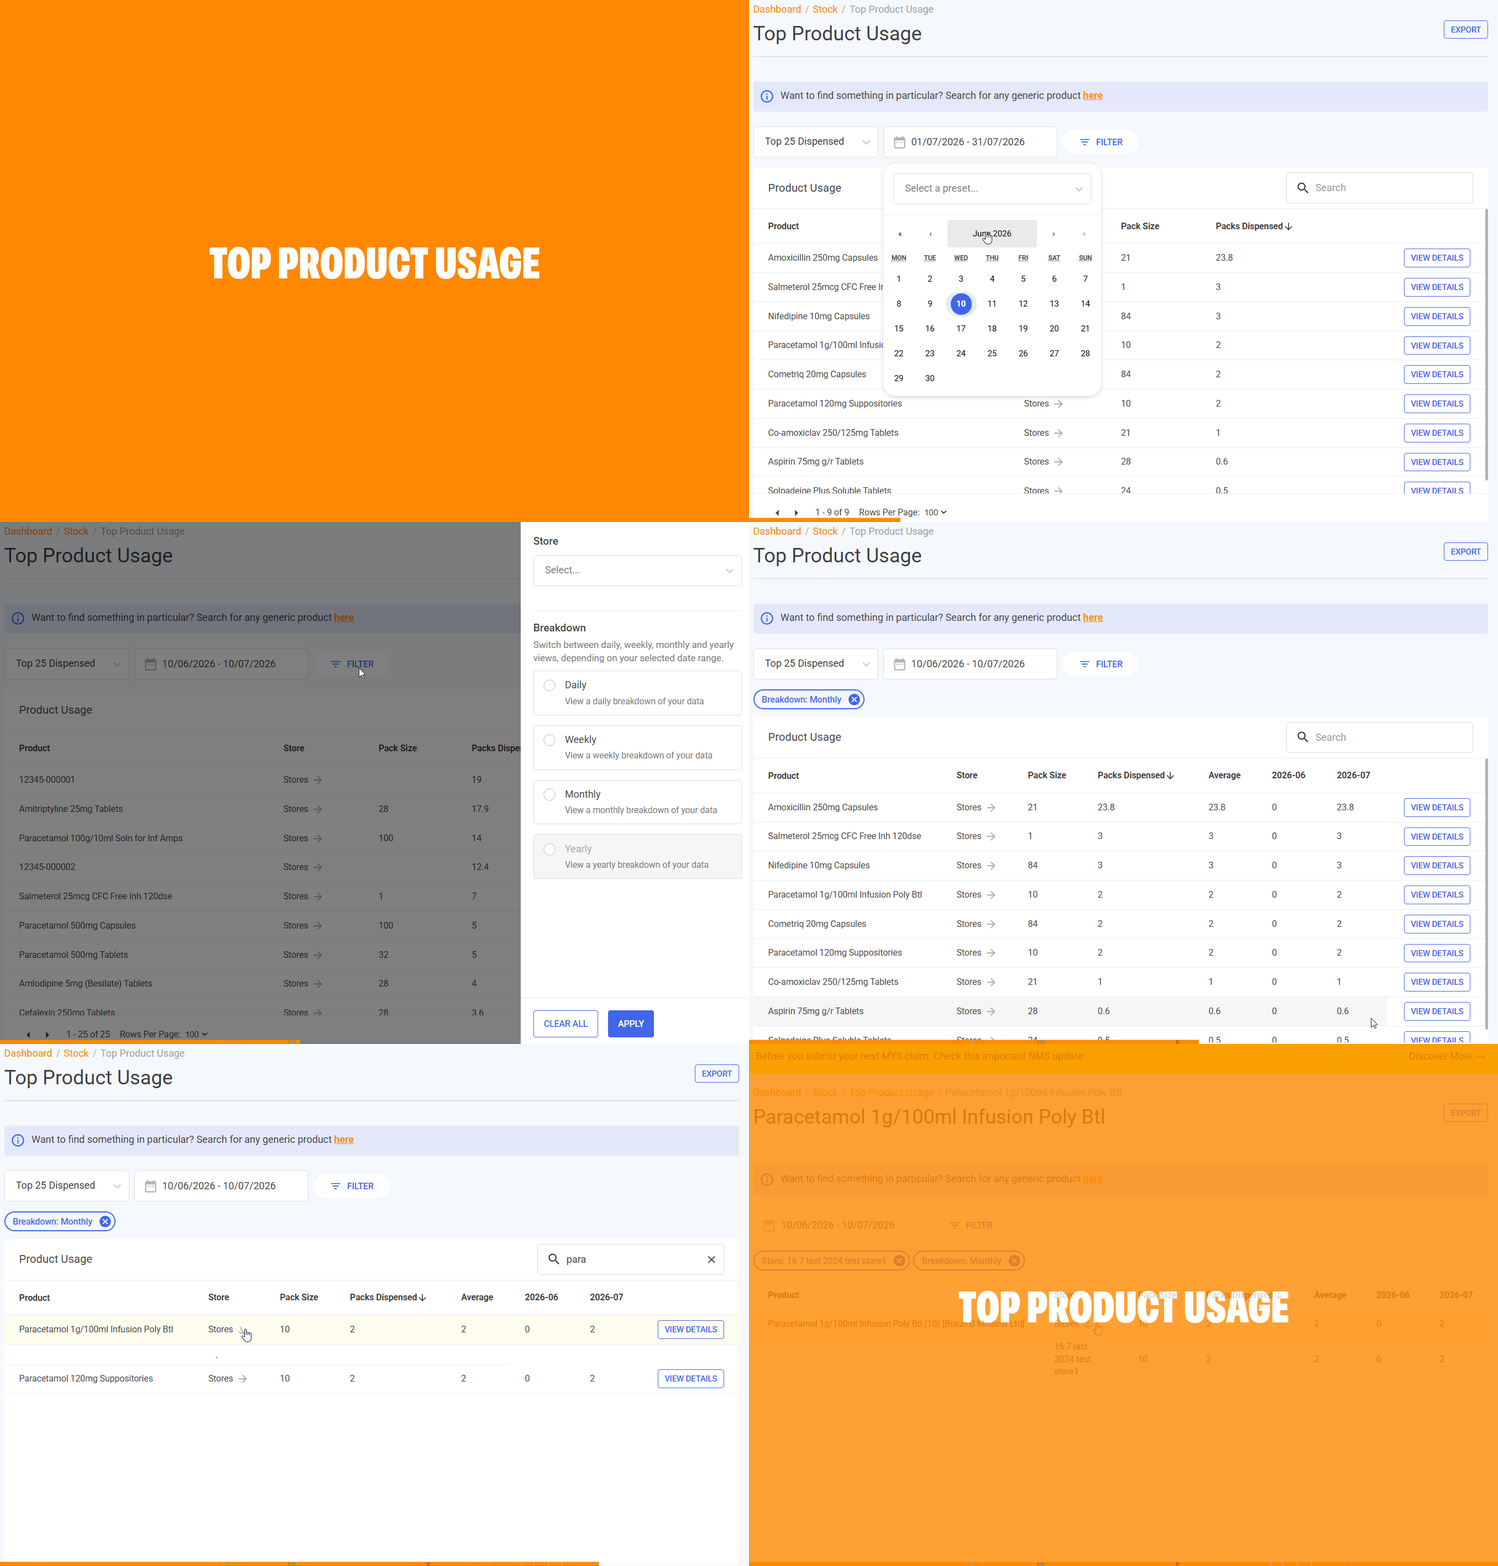
The Top Product Usage report displays an overview of the top dispensed products for your group of stores over a specified date range. Enabling you to easily analyse product usage trends, customise reports to meet your needs, and enjoy improved data visualisation and interaction. The report includes interactive features, such as the ability to toggle the stores list, display daily, weekly, monthly and yearly breakdowns, view product details and export data.
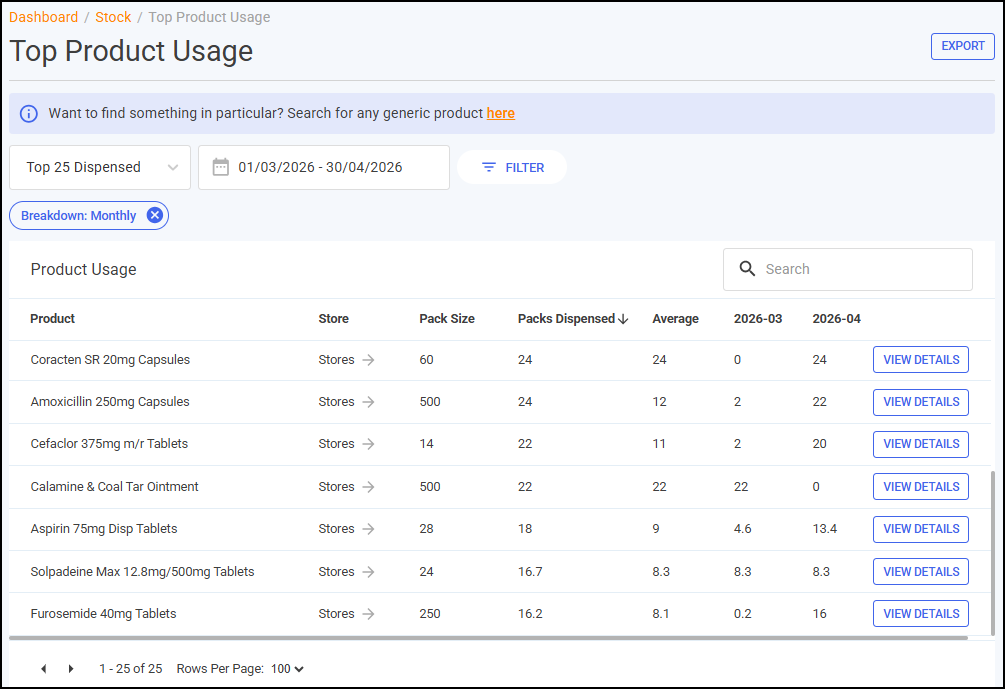
Filtering the Top Product Usage Screen
You can filter the Top Product Usage screen using the following methods:
-
Top 25 to 250 - Select a preset number from the available list ranging from 25 to 250 dispensed products.
-
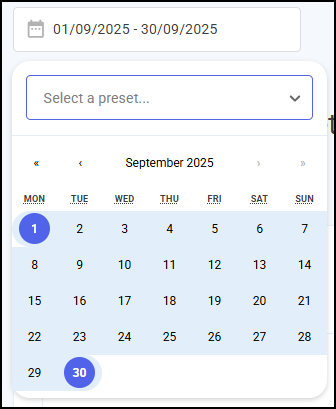
Time Frame - To filter the data by date, you can either:
-
Enter the time frame manually using the calendar, or
-
Select a preset time-frame from the available list.
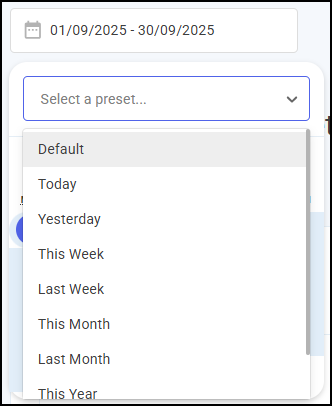 Note - Data from the previous calendar month displays by default.
-
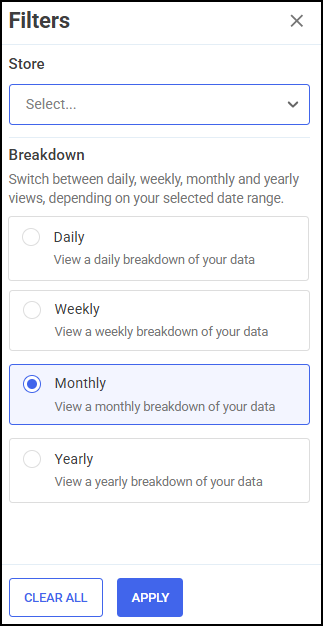
To display more filters, click FILTER  and the Filters screen displays on the right hand side of the screen,
-
Filter by store - To filter the Top Product Usage screen by store, select the required store(s).
To view data for multiple stores, select the individual stores required and the stores display at the top of the list.
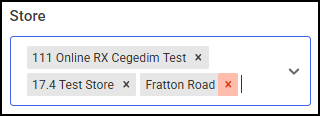 Training Tip - Select
 to remove the store from the filter.
 -
Breakdown - Switch between daily, weekly, monthly and yearly views, based on your selected date range to see a detailed overview of the top-dispensed products.
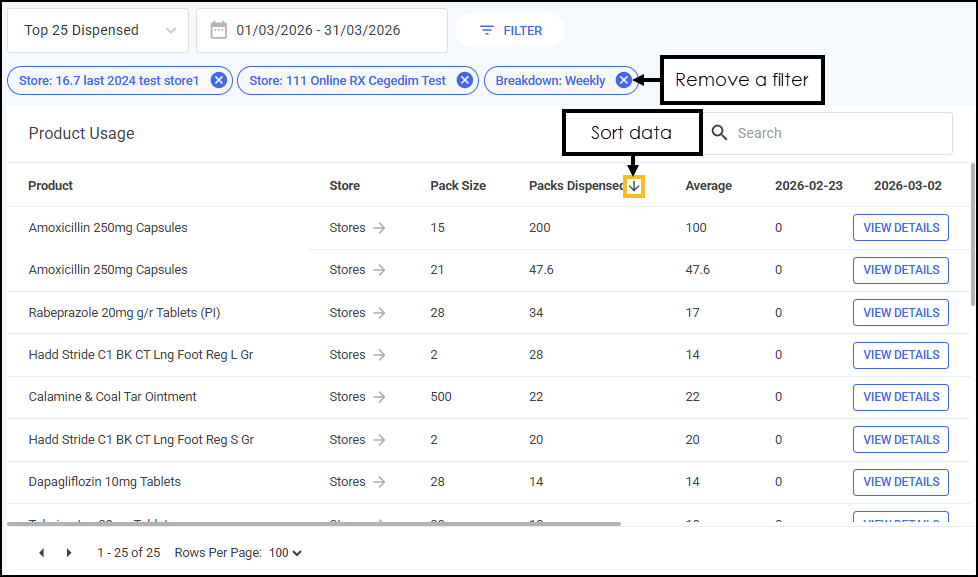 Note - An Average column automatically displays after Packs Dispensed when using time-based filters, showing the average packs dispensed per period for quick trend comparison.
 -
Sort Data - Select either the Product or Packs Dispensed column to sort data by the chosen header, for example, select Product to sort products in alphabetical order.
Store Breakdown
Click the Stores  arrow to view product usage for all stores, or for the selected stores, if you've applied a filter to the Top Product Usage table.
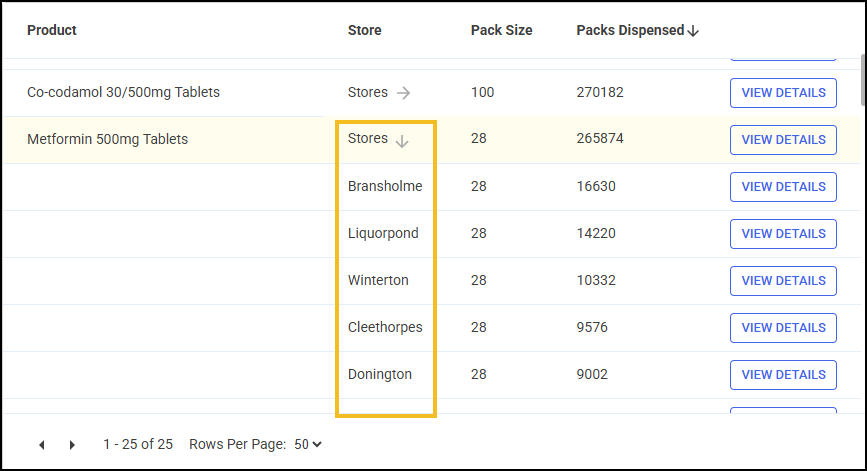
 arrow again to collapse the store breakdown.
 View Details
To view more information about a generic drug or its branded products and manufacturers, click VIEW DETAILS  . This displays additional details about the product. You can use VIEW DETAILS in two ways:
-
Next to a product name, click VIEW DETAILS
to display a list of product brands that have been dispensed under that name for all your stores.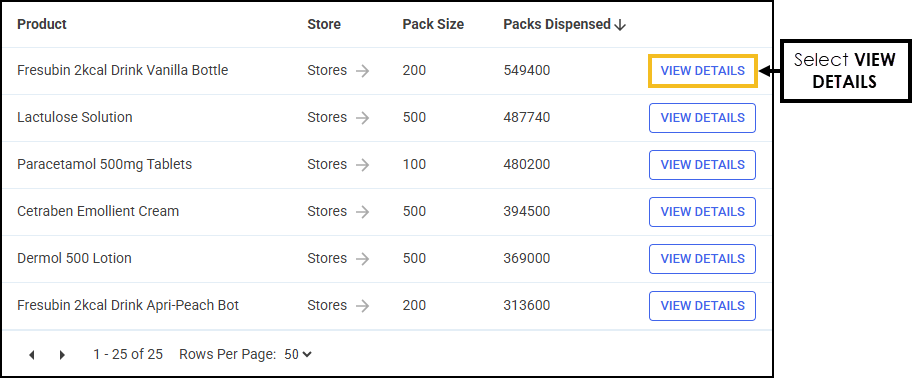
A list of branded products and manufacturers displays, you can click the Stores
arrow to drill-down to store details. 
-
Next to an individual store (when the store breakdown is expanded for a particular product), click VIEW DETAILS
to display the branded product details for that specific store only.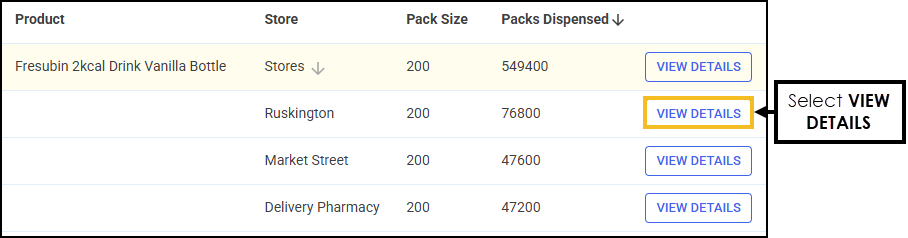
arrow to display the product brand usage for all stores.Exporting Data
To export Top Product Usage data within your group to a CSV (spreadsheet) file:
-
From the Top Product Usage screen, select EXPORT
 .
. -
The Export screen displays.
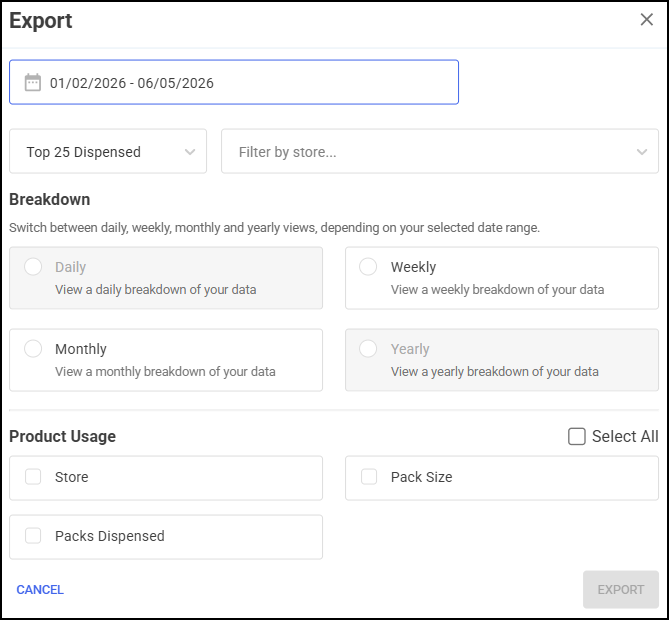
Select from the following:
-
Time Frame - Enter the time frame manually using the calendar.
-
Top 25 to 250 - Select a preset number from the available list ranging from 25 to 250 dispensed products.
-
Filter by store - To export the Top Product Usage data by store, simply select the required store(s) from Filter by store.

To view data for multiple stores, select the individual stores required and the stores display at the top of the list.
Training Tip - Select to remove the store from the filter. -
Breakdown - Select to export daily, weekly, monthly or yearly views of the Top Product Usage data for the selected date time frame.
-
Product Usage - Choose the data that you want to include in the export file.
Training Tip - Tick Select All to include all data on the export file.
-
-
Select EXPORT
 to export the CSV (spreadsheet) file to your local Downloads folder. Training Tip - To view the Downloads folder, open Windows File Explorer, locate and open Downloads. A list of your recently downloaded files display.
 in the top right corner and follow the on-screen prompts.